Uwaga Promocja!
Rabat -
45%
na wszystkie produkty. Podaj w koszyku kod -
O9IU1B7
Do końca oferty pozostało
Thu, 20 Jun 2024 21:59:59 +0000
21:36:32
x
O nas
Produkty
Pomoc
Kontakt
Opinie
Panel klienta
Modne i stylowe fototapety na wymiar
0
szt.
0
00
PLN
Pusty Koszyk
Menu
Przeznaczenie
Fototapety do salonu
Fototapety do sypialni
Fototapety do kuchni
Fototapety do biura
Fototapety do jadalni
Fototapety do łazienki
Fototapety do pokoju dziecka
Fototapety do pokoju nastolatka
Serie
Akwarele
Graffiti
Japonia
Pop Art
Skandynawia
Malarstwo
Żeglarstwo
Kwiaty
Motywy roślinne
3D
Miasta
Uliczki
Kategorie
Krajobraz
Lawendowe pole
Góry
Jeziora
Toskania
Plaża i palmy
Wodospad
Zachód słońca
Lasy i drzewa
Brzozy
Las bambusowy
Las tropikalny
Zamglony las
Kwiaty
Storczyk / orchidea
Dmuchawce
Maki
Tulipany
Słoneczniki
Architetura
Most Brookliński
Wieża Eiffla
Stare uliczki
Mosty
Drapacze chmur
Piramidy
Wielkie miasta
Panorama miasta
Warszawa
Kraków
Nowy Jork
Londyn
Paryż
Rzym
Wenecja
Tokio
Hong Kong
Zwierzęta
Konie
Zebra
Tygrys
Słoń
Flamingi
Jedzenie i napoje
Owoce
Warzywa
Pieczywo
Pierogi
Makarony
Pizza
Przyprawy
Kawa
Wino
Graficzne
Tropikalne liście
Damask
Etno i Folk
BOHO
Skandynawskie
3D / efekt głębi
Orientalne kafle
Geometryczne
Paski
Kółka
Fale
Kropki
Esy Floresy
Abstrakcyjne
Portret
Zwierzęta
Kwiaty
Krajobraz
Miasto
Inspiracje
Blog
Ulubione
Z Twojego zdjęcia
Opcje wyszukiwania
Typ
Fotografia
Wektor
Ilustracja
Wszystko
Położenie
Poziome
Pionowe
Kwadrat
Panoramiczne
Wszystko
Pokaż tylko
Z jednolitym tłem
Wszystko
Kolor
Na okręgu zaznacz szukany kolor a na kwadracie jego natężenie
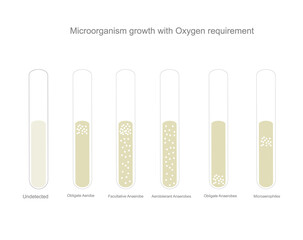
The bacterial identification of microorganism growth with oxygen requirement that show the bacterial type : Obligate Aerobe,Facultative Anaerobe,Aerotolerant Anaerobe,Obligate anaerobe,Microaerophiles
#600465055
Zobacz więcej
The amplification curve of real time-PCR or Qualitative PCR
#476035053
Zobacz więcej
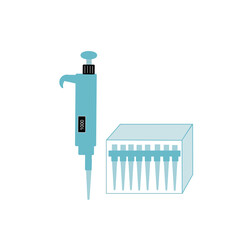
The picture shows laboratory equipment : Autopipette and pipette tips for science research, medical testing or diagnosis.
#593612512
Zobacz więcej
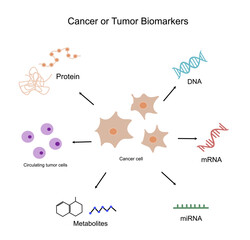
The important biomarkers of cancer or tumor cells for medical diagnosis or science research: Protein, DNA, mRNA, miRNA, biological metabolites and Circulating tumor cells.
#585867968
Zobacz więcej
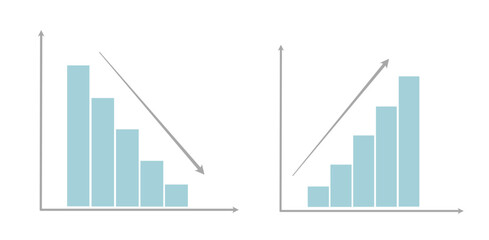
The correlation factor in x and y axis were compared and analyzed that represent in column chart or graph. The analytical target were showed decrease and increase followed by arrow.
#531567664
Zobacz więcej
The real-time PCR steps (denaturation, annealing and polymerization) that showed the used of hydrolysis probe : Taqman (chemistry detection dyes) for signal analysis with qPCR machine
#524889273
Zobacz więcej
The flow cytometry results of apoptosis cell separation in each stage that straining with Propidium iodine (PI) and annexinV-FITC straining, and the result represents in Q1-4 on the diagram
#565948252
Zobacz więcej
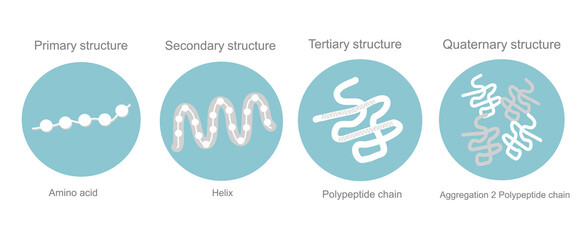
The 4 types of protein structure : primary, secondary, tertiary and quaternary that represent in blue and white concept.
#568468741
Zobacz więcej
The picture of quaternary structure of Hemoglobin (Hb or Hgb): Polypeptide chain (four subunits : two alpha and two Beta chains) that were attached with heme group and iron.
#670098389
Zobacz więcej
The classification types of blood cell in the vessel: platelets, white and Red blood cells
#520589182
Zobacz więcej
The concentration result of target molecule detection on ELISA plate that show the interpretation: High to Low concentration in gradient color
#509286254
Zobacz więcej
The microorganism (microbiology) icon that picture represent various types of bacteria, virus, fungi, protozoa and other
#517499857
Zobacz więcej
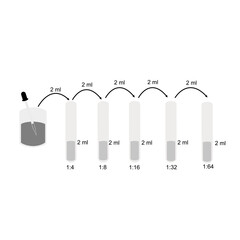
The two-fold serial dilution to reduce the concentrate solution or substance suspension of original solution
#517508064
Zobacz więcej
The central dogma of molecular biology that show concept of blue and white icon: DNA, RNA and protein molecule
#515142752
Zobacz więcej
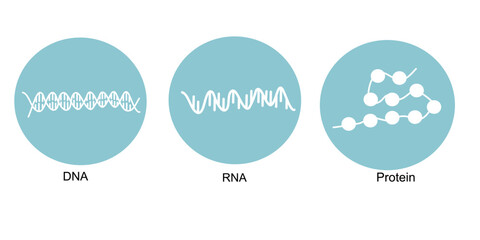
The molecular biology: DNA, RNA and protein that represent in Blue and White icon
#515142658
Zobacz więcej
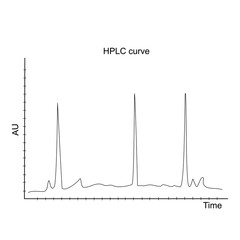
The High Performance Liquid Chromatography (HPLC) that showing the peak appearance of Target and Non-target substance in the analytical sample
#551719600
Zobacz więcej
The result of High performance liquid chromatography (HPLC) of target chemical detection
#534407041
Zobacz więcej
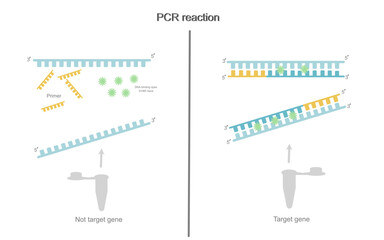
The PCR reaction of target and non-target gene in test tube that used DNA binding dye : SYBR Green for signal analysis by real time PCR machine
#524889257
Zobacz więcej
The amplification curve of nucleic acid detection : target Gene A B C with real -time PCR or qPCR
#522165724
Zobacz więcej
The molecular biology: DNA, RNA and protein molecule that represent the types of nitrogenous bases (ATCG of DNA, AUCG of RNA) and protein (Met, Phe, Gly). Blue and White icon of biological molecule.
#515142793
Zobacz więcej
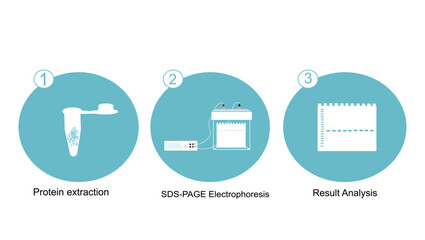
The methodology workflow of protein detection (identify, purify) with SDS-PAGE electrophoresis technique.
#593612537
Zobacz więcej
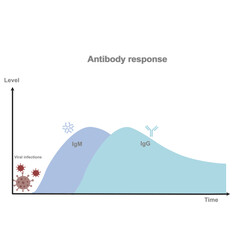
A graph represent the correlation between antibody response (IgM and IgG) level and responding time after viral infection.
#492833300
Zobacz więcej
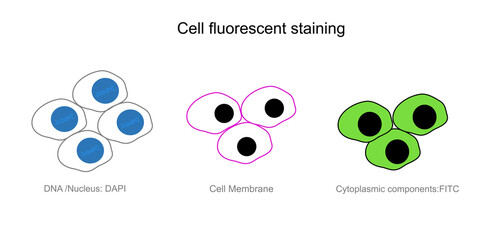
A picture shows the technique of cell fluorescent staining in target cell organelle : cytoplasmic component, cell membrane and DNA or Nucleus.
#786474771
Zobacz więcej
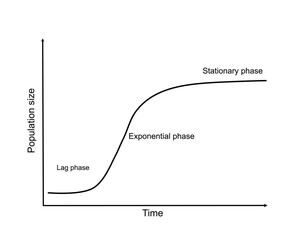
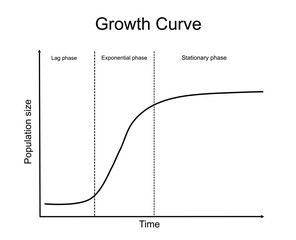
The Growth curves are used to show the relationship between population size and the period of population growth which consists of a lag, Exponential or log, and stationary phase.
#786474769
Zobacz więcej
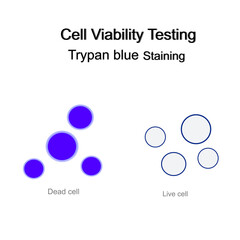
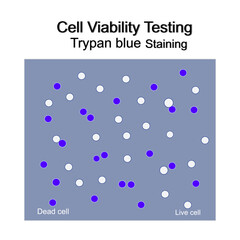
The cell viability testing with Trypan blue staining technique that shows staining comparison between Dead and Live or viable cells.
#786474686
Zobacz więcej
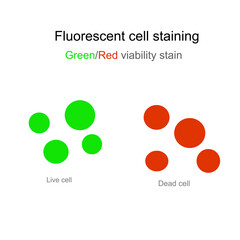
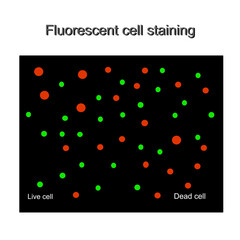
The Fluorescent cell staining that shows Green and Red viability staining of Dead and Live cells.
#786474796
Zobacz więcej
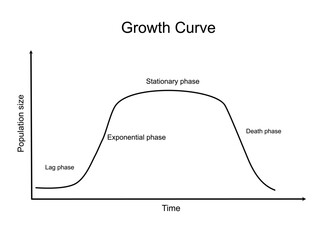
The growth curve of relationship between population size and the growth period that consists of a lag, Exponential or log, stationary and death or decline phase.
#786474757
Zobacz więcej
The Growth curves of relationship between population size and the growth period that identify in lag, Exponential or log, and stationary phase.
#786474743
Zobacz więcej
The cell viability testing with Trypan blue staining technique that represents staining of Dead and Live or viable cells.
#786474733
Zobacz więcej
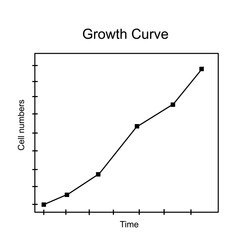
The analytical result of growth rate that shows the correlation between cell number and time in the curve.
#786474818
Zobacz więcej
The picture shows the result of fluorescent cell staining, which shows viability staining of dead and viable or live cells in red and green,respectively.
#786474817
Zobacz więcej
The detection result of target protein with a direct sandwich ELISA technique that interpret is detected or undetected when the signal appearing or not, after the sample dropping and finish
#510533799
Zobacz więcej
The icon of DNA sequencing workflow with next generation sequencing technique in sample of Liquid biopsy (blood) of three step : Sample collection(Blood), Extraction and Analyzing.
#573261074
Zobacz więcej
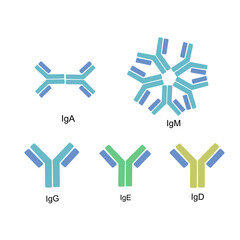
The 5 types (isotypes) of Immunoglobulin or Antibodies :IgA, IgM, IgG, IgE and IgD
#482183193
Zobacz więcej
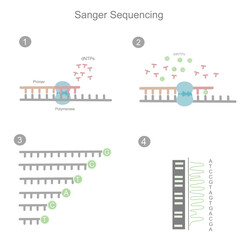
The workflow of Sanger sequencing in the first generation for investigating the DNA sequence of target sample that represent in four simple steps.
#570944880
Zobacz więcej
The cellular markers on the cell surface was bound by specific antibody for target cell detection.
#646434849
Zobacz więcej
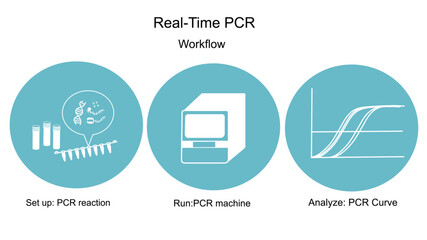
The workflow of real-time Polymerase Chain Reaction(PCR) that shows important step in blue and white icon concept: Set up (master mixes preparation),Run (qPCR machines),Analysis (amplification curve).
#646361105
Zobacz więcej
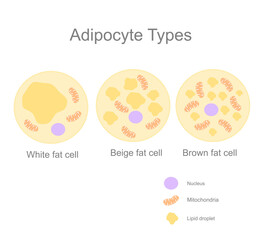
The type of fat cell or adipocyte (adipose cell) : White, Beige and Brown cells that shows different component, including Nucleus, Mitochondria and lipid droplet.
#670098427
Zobacz więcej
The Histogram of fluorescence intensity that shows the relative of PI Fluorescence and the analytic of cell sample counts.
#651954164
Zobacz więcej
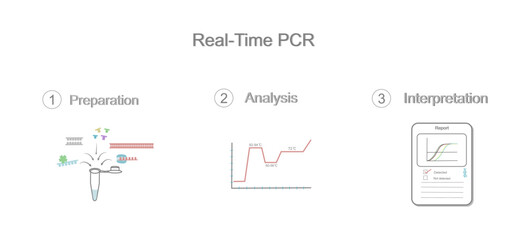
The important steps of real-time Polymerase Chain Reaction (PCR) that represents Master mixes preparation, Analysis (qPCR machines) and Interpretation (amplification curve).
#646361128
Zobacz więcej
The picture represents the diagnosis report that shows the analysis result, sample test tube and scientist signature for result certification.
#646361114
Zobacz więcej
The scientific report represent the interpretation of DNA detection with real-time PCR or qPCR technique.
#646361112
Zobacz więcej
The principle of ELISA technique that shows the target antigen were bonded with primary antibody and secondary antibody (labelled with detected molecule).
#629172256
Zobacz więcej
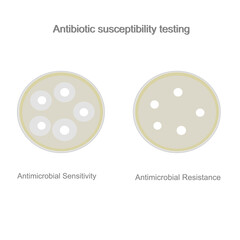
The result of Antibiotic susceptibility testing : Antimicrobial Sensitivity and Resistance for determine the microbial (bacteria or fungus) growth with antibiotic drugs pad.
#610946031
Zobacz więcej
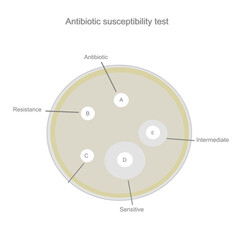
The result of Antibiotic susceptibility test: Resistance, Sensitive and Intermediate Bacteria or fungal that show inhibition zone around antimicrobial drugs pad (A, B, C, D, E).
#610366898
Zobacz więcej
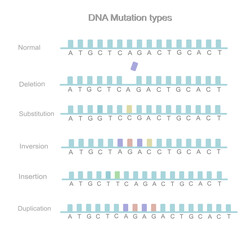
The types of DNA mutation: Deletion, Substitution, Inversion, Insertion and Duplication that picture shows the comparison between normal and mutated sequences on DNA strands.
#560762633
Zobacz więcej
The staining position of target cells for Cell fluorescent staining : DNA or Nucleus, Cell membrane and Cytoplasmic component.
#780728266
Zobacz więcej
The Gene therapy technique that replacing or instead the broken or missing gene (Non-functional gene) with Functional gene for correcting ,treat or prevent the genetic ploblem or disease.
#780712545
Zobacz więcej
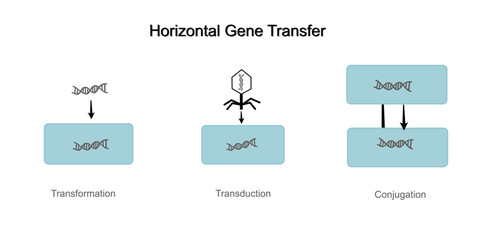
The classical methods of horizontal gene (DNA) transfer: Transformation, Transduction and Conjugation.
#780712561
Zobacz więcej
«
1
2
3
4
…
11
»
Copyright
Fototapeta4U.pl
2024