Uwaga Promocja!
Rabat -
45%
na wszystkie produkty. Podaj w koszyku kod -
SAUYLZF
Do końca oferty pozostało
Wed, 29 May 2024 21:59:59 +0000
14:0:29
x
O nas
Produkty
Pomoc
Kontakt
Opinie
Panel klienta
Modne i stylowe fototapety na wymiar
0
szt.
0
00
PLN
Pusty Koszyk
Menu
Przeznaczenie
Fototapety do salonu
Fototapety do sypialni
Fototapety do kuchni
Fototapety do biura
Fototapety do jadalni
Fototapety do łazienki
Fototapety do pokoju dziecka
Fototapety do pokoju nastolatka
Serie
Akwarele
Graffiti
Japonia
Pop Art
Skandynawia
Malarstwo
Żeglarstwo
Kwiaty
Motywy roślinne
3D
Miasta
Uliczki
Kategorie
Krajobraz
Lawendowe pole
Góry
Jeziora
Toskania
Plaża i palmy
Wodospad
Zachód słońca
Lasy i drzewa
Brzozy
Las bambusowy
Las tropikalny
Zamglony las
Kwiaty
Storczyk / orchidea
Dmuchawce
Maki
Tulipany
Słoneczniki
Architetura
Most Brookliński
Wieża Eiffla
Stare uliczki
Mosty
Drapacze chmur
Piramidy
Wielkie miasta
Panorama miasta
Warszawa
Kraków
Nowy Jork
Londyn
Paryż
Rzym
Wenecja
Tokio
Hong Kong
Zwierzęta
Konie
Zebra
Tygrys
Słoń
Flamingi
Jedzenie i napoje
Owoce
Warzywa
Pieczywo
Pierogi
Makarony
Pizza
Przyprawy
Kawa
Wino
Graficzne
Tropikalne liście
Damask
Etno i Folk
BOHO
Skandynawskie
3D / efekt głębi
Orientalne kafle
Geometryczne
Paski
Kółka
Fale
Kropki
Esy Floresy
Abstrakcyjne
Portret
Zwierzęta
Kwiaty
Krajobraz
Miasto
Inspiracje
Blog
Ulubione
Z Twojego zdjęcia
Opcje wyszukiwania
Typ
Fotografia
Wektor
Ilustracja
Wszystko
Położenie
Poziome
Pionowe
Kwadrat
Panoramiczne
Wszystko
Pokaż tylko
Z jednolitym tłem
Wszystko
Kolor
Na okręgu zaznacz szukany kolor a na kwadracie jego natężenie
Abstract Data Visualization in XN Dimensions: A Symphony of Chaos and Order
#818230735
Zobacz więcej
Bubble chart showcasing correlations between various financial metrics
#789913881
Zobacz więcej
Abstract Neural Network or Big Data Distribution 3d Illustration
#119167546
Zobacz więcej
A scatter plot depicting the correlation between training program participation and employee performance metrics
#794250671
Zobacz więcej
Text CORRELATION COEFFICIENT on Office desk table with keyboard, notepad and analysis chart on white background.
#530584138
Zobacz więcej
Generate an image showing interdisciplinary research teams working together to address pressing global issues such as climate change public health or sustainable development.
#813957562
Zobacz więcej
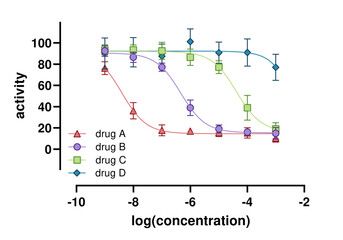
Dose-response curves demonstrating activity profiles of four different drugs acting on the same molecular target with varying inhibitory efficacy.
#526070992
Zobacz więcej
Negative correlation between stock prices and interest rates in a scatter plot depicting macroeconomic impact. Concept Stock prices, Interest rates, Macroeconomic impact, Scatter plot
#784551382
Zobacz więcej
A scatter plot mapping data points to analyze correlations and patterns
#808022478
Zobacz więcej
Scatter plot showing negative correlation between stock prices and interest rates. Concept Stock Prices, Interest Rates, Negative Correlation, Scatter Plot
#822682023
Zobacz więcej
A scatter plot showing a strong positive correlation between stock prices and trading volume, indicating increased investor interest.
#741324803
Zobacz więcej
A 3D scatter plot showing correlation between customer satisfaction and sales performance, with an interactive tooltip highlighting key data points
#797249589
Zobacz więcej
A magnifying glass analyzing a scatter plot, showing correlations between variables in a scientific research dataset.
#827532209
Zobacz więcej
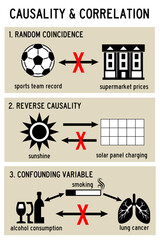
causality correlation
#539130406
Zobacz więcej
Data Mining and Pattern Recognition, data mining and pattern recognition with showing data analysts discovering recurring patterns, anomalies, and correlations within datasets,
#774310111
Zobacz więcej
3D-rendered abstract background with quantum correlation glow
#714568569
Zobacz więcej
A scientist analyzes data on a computer screen, a graph showing the correlation between deforestation and rising CO₂ levels. Their determined expression conveys the urgency of protecting our forests
#753451359
Zobacz więcej
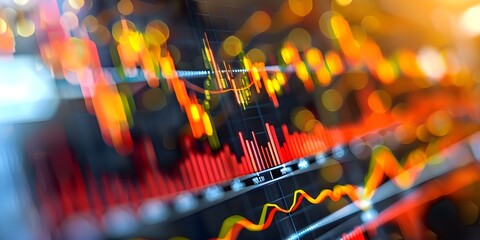
A close-up view of a sleek stock market chart, featuring minimalist design elements and precise data points for clarity.
#772810970
Zobacz więcej
The process of examining large datasets to uncover hidden patterns, correlations, and insights that inform decision-making and drive business outcomes
#748761171
Zobacz więcej
Analytic HUD for data sorting Background of sorting lines Big data modern background, Negative correlation between stock prices and interest rates in a scatter plot depicting macroeconomic impact Con
#786584187
Zobacz więcej
Combination of light bulb with wheat cluster and wind turbine and water dam and agricultural land from a closeup view, flight event, water food energy correlation competition
#778867443
Zobacz więcej
3D graph of stock market indices across different countries, ideal for global financial comparisons or multinational corporate strategies
#809422896
Zobacz więcej
Infographic showing correlation between oil prices and war events, sleek design, neon accents, clear data points
#830130331
Zobacz więcej
A captivating scatter plot representing correlations between variables with precise data points scattered across the graph
#799241346
Zobacz więcej
CORRELATION document with pen,graph and magnifier, calculator
#456693775
Zobacz więcej
A computer screen filled with multiple lines and dots, representing complex data and patterns, A scatter plot showing the correlation between market volatility and trade volume, AI Generated
#779670375
Zobacz więcej
Visualize the iterative nature of data analysis with initial findings leading to further exploration and refinement of hypotheses through additional experiments or observations.
#813998895
Zobacz więcej
Negative correlation between stock prices and interest rates in a scatter plot depicting macroeconomic impact. Concept Stock prices, Interest rates, Macroeconomic impact, Scatter plot
#786941129
Zobacz więcej
A data visualization showcasing the correlation between PM 2.5 and decreased productivity in streamers.
#807742182
Zobacz więcej
Stock prices and interest rates show a negative correlation in macroeconomics data. Concept Macroeconomics Data, Stock Prices, Interest Rates, Negative Correlation
#819843138
Zobacz więcej
A magnified image of a brain showing the gradual shrinkage of neurons and its correlation to cognitive decline in old age.
#715206671
Zobacz więcej
A scatter plot depicting a negative correlation between stock prices and interest rates, indicating the influence of macroeconomic factors.
#741384412
Zobacz więcej
Web Link
#385181235
Zobacz więcej
Quantum Entanglement: The Interwoven Threads of Reality
#802516359
Zobacz więcej
Close-up of a bar graph showing the correlation between gold prices and inflation rates, highlighting its value as a hedge
#796225569
Zobacz więcej
Elegant infographic illustrating the correlation between cybersecurity investment and reduced risk, set against a clean, modern backdrop.
#768016397
Zobacz więcej
相関係数 のホワイトボード風イラスト
#809824894
Zobacz więcej
Information Network
#246913367
Zobacz więcej
Mix icon for correlation
#569822355
Zobacz więcej
A scatter plot depicting the correlation between customer demographics and purchase behavior
#794249101
Zobacz więcej
Aesthetic synergy Light bulb, wheat, wind turbine, water dam, and agricultural land blend in flight event symbolizing water-food-energy correlation competition
#788671487
Zobacz więcej
Data Grid: A 3D vector visualization of a grid filled with data points
#797676123
Zobacz więcej
A US dollar bill takes center stage in front of a dynamic stock chart, symbolizing the correlation between currency and financial markets
#795228337
Zobacz więcej
CORRELATION - Red text on typography background - 3D rendered royalty free stock image. This image can be used for an online website banner ad or a print postcard.
#128123905
Zobacz więcej
3D-rendered abstract background with quantum correlation glow
#720996795
Zobacz więcej
Financial infographic stock market chart
#705253329
Zobacz więcej
Design an infographic outlining the characteristics of scientific inquiry including curiosity skepticism objectivity and openness to new ideas.
#813941715
Zobacz więcej
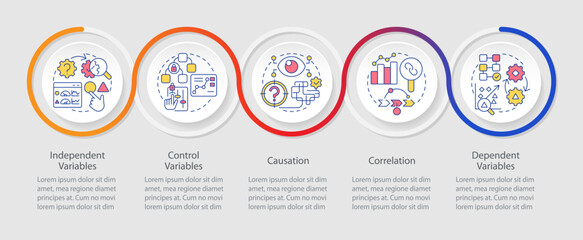
Causal research variables and principles loop infographic template. Data visualization with 5 steps. Editable timeline info chart. Workflow layout with line icons. Myriad Pro-Bold, Regular fonts used
#589004035
Zobacz więcej
Financial analyst reviewing detailed stock market charts on a computer, highlighting trends and forecasting future movements
#801700208
Zobacz więcej
«
1
2
3
…
150
»
Copyright
Fototapeta4U.pl
2024